Air pressure is the pressure that air exerts on objects, liquids, and gases in the Earth’s atmosphere. Air pressure exists because air is under the influence of gravity and therefore has weight. Air pressure acts in all directions.
The mass of the Earth’s atmosphere is about 5·1018 kg and the surface area of the Earth is about 5· 1014 m2 . About 10,000 kg of air presses on each square meter of the Earth’s surface. As altitude increases, the length of the downward pressure column decreases. Therefore, atmospheric pressure decreases with altitude.
In weather reports, air pressure is traditionally expressed in millibars and today in hectopascals (hPa). The pascal is an official unit in the International System of Units (SI), but the units are numerically equivalent: for example, the atmospheric pressure at sea level is about 1013 hPa and is approximately equal to 1013 millibars.
Air pressure
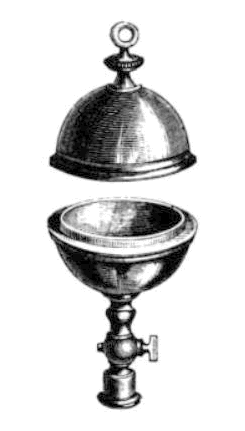
The strength of air pressure was demonstrated as early as 1654 by the classic experiment with two hemispheres in Magdeburg. Since one weather station is higher above sea level than the other, not all weather stations on the ground necessarily measure atmospheric pressure values. For a correct comparison, the air pressure at most weather stations on the ground is converted to mean sea level. A different method is used at very high mountain stations. Weather balloons can measure air pressure and other parameters up to an altitude of about 40 km to get a more complete picture of the state of the atmosphere.
Air pressure is measured using a barometer. Most modern manometers have a nearly airless box, which is pressurized more or less depending on the pressure (Vidi box). Pressing the box slightly or strongly will cause the attached pointer to move, which will move to a display on which the air pressure can be read. Many home manometers use this principle. Many home sphygmomanometers still have a mercury pressure scale in millimeters of mercury. This unit can be easily converted to hectopascals by multiplying the number in millimeters of mercury pressure by 1.333. The standard atmospheric pressure is 76 cmHg (760 mmHg) = 1013 hPa = 1.013 bar = 1 atmosphere. This is also called standard pressure. In real mercury manometers, if high accuracy is required, the change in the density of mercury under the influence of temperature changes must be taken into account.
Pressure systems
Air pressure measured for meteorological purposes is important for a meteorologist to understand where important pressure systems such as low-pressure and high-pressure zones are located. A climate map with isobars can be drawn based on a large number of geographically distributed atmospheric pressure values down to sea level. Isobars are lines connecting points of equal atmospheric pressure. In many countries of the world, isobars are drawn every 5 hPa (e.g. 995, 1000, 1005 hPa, etc.). From the isobaric pattern, different pressure centers can be found and an idea of wind direction and wind speed can be obtained. The following pressure systems are distinguished:
- An area of low pressure, also called a minimum or depression. Isobars form closed bands around a low-pressure core, while cyclonic circulation is present.
- High pressure area, also called a maximum or anticyclone. The core of the closed isobars here has relatively high pressure where anticyclonic circulation occurs.
- Saddle region, the transitional region at the intersection of two high-pressure and two low-pressure regions.
- A depression is an elongated area of low air pressure and a widening low-pressure area. The distance between the isobars is usually small and as a result the wind speed is high.
- The vore is the small trough where the distance between isobars is greatest. It is a bit windy here. The concept of vore is still not widely used. This is also commonly referred to as the leading distance.
- A ridge, part of a V-shaped high-pressure area, usually having the largest isobaric distance.
the weather
Most amateur barometers have titles such as “fair,” “constant,” “variable,” “rain,” and “storm.” These references date back to earlier times, when little was known about the relationship between climate and atmospheric pressure.
A pressure above 1030 or 1040 hPa does not always mean sunny weather. It could be fog or rain. Rainfall is usually limited to a few millimeters at most at high pressure, but there have been occasions when 10 to 15 mm of localized showers have fallen at 1030 hPa. Conversely, in a low pressure area it can be sunny, dry and calm. This depends mainly on where the center of the pressure area is located relative to the ground. Depending on this, we may have humid weather with clouds or fog, or conversely, we may have dry and sunny weather.
However, precipitation is generally more likely at low pressure than at high pressure. Comparing daily barometer readings and weather shows that the chance of precipitation at a low pressure of 990 hPa is 80%. This means that eight times out of ten it will rain or snow. At 1000 hPa the chance of precipitation is 70%, at 1010 hPa 40%, at 1020 hPa 20%, and above 1030 hPa only 10%.
Today, air pressure measurements (and other quantities) from around the world are fed into mathematical models that are calculated on a network of supercomputers for weather forecasting and climatology research.

Air pressure varies depending on location.
Wind force is determined by the air pressure gradient, which is the change in air pressure per unit distance , and which is always perpendicular to the isobars. Therefore, the air pressure gradient is greatest where the distance between the isobars is smallest. According to the law of vote buying, the wind speed will be high there, regardless of whether the air pressure is low or high in that area.
Air pressure changes with time.
Air pressure is never constant. A decrease in air pressure in a high-pressure area is called a depression in a high-pressure area and an increase in air pressure in a high-pressure area building. In a low-pressure area, a decrease in air pressure is called a deepening and an increase is called a filling. Changes in air pressure are often related to the tension of a pressure system. This is represented by isobars, which are lines on which the air pressure changes by the same amount over a period of time.
Rapid changes in pressure are often associated with strong winds or are a precursor to storms. If a barometer reading rises or falls rapidly, it usually means that the weather is about to change. Research on the relationship between barometers and climate shows that in 80% of cases, increasing air pressure leads to better weather and decreasing air pressure leads to worse weather.
Daily routine
Under the influence of the sun, the weather changes during the day. This daily pattern occurs with solar radiation, terrestrial radiation, air temperature, wind, cloud cover and air humidity. Atmospheric pressure has a two-day period. This is especially easy to detect in a barograph in tropical regions due to the non-periodic variation of low pressure systems.
Especially in the tropics, diurnal motion creates both land and sea winds because the sea surface is much warmer, so diurnal motion is minimal.
Moon effect
Atmospheric pressure also shows periodic variation due to tides, which are similar to ocean tides. The greatest effect is in the tropics. The amplitude is a few millibars and is almost zero at the poles.
highly calculated values
On 26 January 1932, an air pressure of 1050.0 hPa was measured in De Bilt, the highest pressure ever measured by KNMI. The air pressure was very high for several days in a row: an average of 1048 hPa was calculated in 48 hours in De Bilt. On 23 January 1907, the air pressure in De Bilt rose to 1047.9 hPa, and on 23 December 1962, it was measured at 1047.8 hPa.
The RMI record in Uccle was recently broken: on January 20, 2020, the air pressure was measured at 1048.3 hPa [ 1 ] . The previous record was on January 27, 1932: 1048.0 hPa.
The highest air pressure values are usually measured in the winter months. During the summer, barometers rarely exceed 1035 hPa, and daily variations in air pressure are much lower than at other times of the year. In autumn, especially from mid-October, the air pressure can change rapidly from day to day and the lowest values are generally measured. For example, the July air pressure in De Baillet never exceeded 1033 hPa, and in August the century record was 1034 hPa.
High pressure areas are known in winter for their high air pressure values. Air pressures above 1050 hPa often occur in winter, especially over Siberia. On December 31, 1968, a record of 1083.8 hPa was recorded in the Siberian city of Agata (350 km southeast of Norilsk). In 2011, a value of 1084.4 hPa was measured in Tusontsengil, Mongolia. This is the highest air pressure value measured so far in 2019. [ 2 ] Most home, garden and kitchen scales cannot display this value.
The lowest air pressure ever measured by KNMI in Depilat was 956.4 hPa on 26 February 1989. An air pressure of 954.4 hPa was measured in Vlissingen on that day, but the record for the Netherlands is 954.2 hPa, measured in Eelde on 27 November 1983. The record air pressure in the British Isles is 936 hPa, measured on the night of 19–20 December 1982 in north-west Scotland. On 26 January 1884, the pressure in Scotland fell to 925.6 hPa.
The atmospheric pressure values are noticeably lower in the North Atlantic. On December 15, 1986, the air pressure in the sea area southwest of Iceland dropped to 920.2 hPa, the lowest pressure ever measured in that area. From measurements near the bottom, KNMI was able to conclude that the air pressure in the center of the low pressure area must have been about 915 hPa. On January 11, 1993, the atmospheric pressure near Iceland dropped again to very low values, estimated at about 916 hPa.
In 2005, during the very active Atlantic hurricane season, Hurricane Wilma reached a low of 882 hPa. Wilma became one of the most active hurricanes of the season.

Dependence of atmospheric pressure on altitude and temperature
[ Edit | Edit source text ]
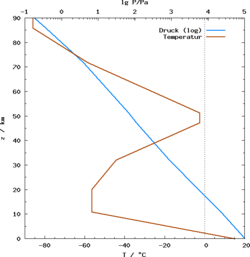
At equilibrium, the air pressure P(h) decreases approximately with height according to the barometric altitude equation:
- P(hour)=P0⋅e-mhour/art

where
M: average molar mass of air; about 0.029 kg/mol g
: acceleration due to gravity; 9.8 m/ s2 at sea level h: height in meters R: universal gas constant; 8.3145 J/(mol.K) T: absolute temperature in K P0 : air pressure at sea level. This formula is only an approximation , as both T and g are assumed to be constant at all altitudes. In addition, the different molar masses of nitrogen (28 kg/mol km) and oxygen (32 kg/mol km) must be calculated separately. However, the graph above shows that the effect of all these simplifications is marginal, as the measured pressure, plotted on a logarithmic scale, has an almost linear progression as a function of altitude. Therefore, the pressure in absolute terms per meter decreases faster in the lower layers of the atmosphere than in the upper layers. At the bottom of the atmosphere, the atmospheric pressure decreases by about 13 Pa per meter. At an altitude of 5.5 km, the pressure has already dropped by about 50%.